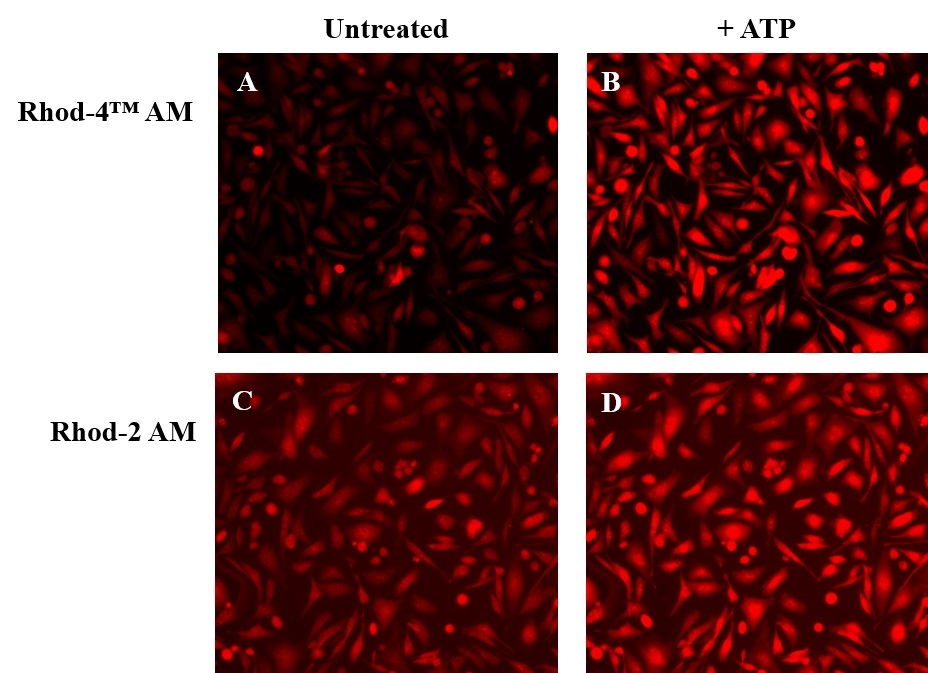
Rhod-4™, AM
Price | |
Catalog Number | |
Availability | In stock |
Unit Size | |
Quantity |
Telephone | 1-800-990-8053 |
Fax | 1-800-609-2943 |
sales@aatbio.com | |
International | See distributors |
Bulk request | Inquire |
Custom size | Inquire |
Shipping | Standard overnight for United States, inquire for international |
Dissociation constant (Kd, nM) | 451 |
Molecular weight | 1015.96 |
Solvent | DMSO |
Excitation (nm) | 523 |
Emission (nm) | 551 |
Quantum yield | 0.11 |
Certificate of Origin | Download PDF |
H-phrase | H303, H313, H333 |
Hazard symbol | XN |
Intended use | Research Use Only (RUO) |
R-phrase | R20, R21, R22 |
Storage | Freeze (< -15 °C); Minimize light exposure |
UNSPSC | 12352200 |
Rhod-4™, sodium salt |
Rhod-4™, potassium salt |
Overview | ![]() ![]() |
Molecular weight 1015.96 | Dissociation constant (Kd, nM) 451 | Excitation (nm) 523 | Emission (nm) 551 | Quantum yield 0.11 |
Platform
Fluorescence microscope
Excitation | TRITC filter set |
Emission | TRITC filter set |
Recommended plate | Black wall/clear bottom |
Fluorescence microplate reader
Excitation | 540 |
Emission | 590 |
Cutoff | 570 |
Recommended plate | Black wall/clear bottom |
Instrument specification(s) | Bottom read mode/Programmable liquid handling |
Example protocol
PREPARATION OF STOCK SOLUTIONS
Unless otherwise noted, all unused stock solutions should be divided into single-use aliquots and stored at -20 °C after preparation. Avoid repeated freeze-thaw cycles
Prepare a 2 to 5 mM stock solution of Rhod-4™ AM in high-quality, anhydrous DMSO.
PREPARATION OF WORKING SOLUTION
On the day of the experiment, either dissolve Rhod-4™ AM in DMSO or thaw an aliquot of the indicator stock solution to room temperature.
Prepare a 2 to 20 µM Rhod-4™ AM working solution in a buffer of your choice (e.g., Hanks and Hepes buffer) with 0.04% Pluronic® F-127. For most cell lines, Rhod-4™ AM at a final concentration of 4-5 μM is recommended. The exact concentration of indicators required for cell loading must be determined empirically.
Note: The nonionic detergent Pluronic® F-127 is sometimes used to increase the aqueous solubility of Rhod-4™ AM. A variety of Pluronic® F-127 solutions can be purchased from AAT Bioquest.
Note: If your cells contain organic anion-transporters, probenecid (1-2 mM) may be added to the dye working solution (final in well concentration will be 0.5-1 mM) to reduce leakage of the de-esterified indicators. A variety of ReadiUse™ Probenecid products, including water-soluble, sodium salt, and stabilized solutions, can be purchased from AAT Bioquest.
SAMPLE EXPERIMENTAL PROTOCOL
Following is our recommended protocol for loading AM esters into live cells. This protocol only provides a guideline and should be modified according to your specific needs.
- Prepare cells in growth medium overnight.
On the next day, add 1X Rhod-4™ AM working solution to your cell plate.
Note: If your compound(s) interfere with the serum, replace the growth medium with fresh HHBS buffer before dye-loading.
Incubate the dye-loaded plate in a cell incubator at 37 °C for 30 to 60 minutes.
Note: Incubating the dye for longer than 1 hour can improve signal intensities in certain cell lines.
- Replace the dye working solution with HHBS or buffer of your choice (containing an anion transporter inhibitor, such as 1 mM probenecid, if applicable) to remove any excess probes.
- Add the stimulant as desired and simultaneously measure fluorescence using either a fluorescence microscope equipped with a TRITC filter set or a fluorescence plate reader containing a programmable liquid handling system such as an FDSS, FLIPR, or FlexStation, at Ex/Em = 540/590 nm cutoff 570 nm.
Calculators
Common stock solution preparation
0.1 mg | 0.5 mg | 1 mg | 5 mg | 10 mg | |
1 mM | 98.429 µL | 492.145 µL | 984.291 µL | 4.921 mL | 9.843 mL |
5 mM | 19.686 µL | 98.429 µL | 196.858 µL | 984.291 µL | 1.969 mL |
10 mM | 9.843 µL | 49.215 µL | 98.429 µL | 492.145 µL | 984.291 µL |
Molarity calculator
Mass (Calculate) | Molecular weight | Volume (Calculate) | Concentration (Calculate) | Moles | ||||
/ | = | x | = |
Spectrum
![spectrum](/_next/image?url=https%3A%2F%2Fimages.aatbio.com%2Fspectra%2Frhod_4.png&w=2048&q=50)
Spectral properties
Excitation (nm) | 523 |
Emission (nm) | 551 |
Quantum yield | 0.11 |
Product Family
Name | Excitation (nm) | Emission (nm) | Quantum yield |
Rhod-4™ amine | 523 | 551 | 0.11 |
Rhod-4™ azide | 523 | 551 | 0.11 |
Rhod-4™ alkyne | 523 | 551 | 0.11 |
Rhod-4™ maleimide | 523 | 551 | 0.11 |
Fluo-4 AM *Ultrapure Grade* *CAS 273221-67-3* | 495 | 528 | 0.161 |
Rhod-2, AM *CAS#: 145037-81-6* | 553 | 577 | 0.11 |
Rhod-2, AM *UltraPure Grade* *CAS#: 145037-81-6* | 553 | 577 | 0.11 |
Rhod-5N, AM | 557 | 580 | - |
Rhod-FF, AM | 553 | 577 | - |
Images
![ATP-stimulated calcium responses of endogenous P2Y receptors were measured in CHO-K1 cells with Rhod-4™ AM (Cat# 21120) and Rhod-2 AM (Cat# 21064). CHO-K1 cells were seeded overnight at 50,000 cells/100 µL/well in a Costar 96-well black wall/clear bottom plate. The growth medium was removed, and the cells were incubated with 100 µL of dye loading solution using Rhod-4™ AM (4 µM, A and B) or Rhod-2 AM (4 µM, C and D) for 1 hour in a 37 °C, 5% CO2 incubator. The staining solution was replaced with 200 µL HHBS, then the cells were imaged before (A and C) and after (B and D) ATP treatment with a fluorescence microscope (Olympus IX71) using TRITC channel.](/_next/image?url=https%3A%2F%2Fimages.aatbio.com%2Fproducts%2Ffigures-and-data%2Frhod-4-am%2Ffigure-for-rhod-4-am_wwHLs.jpg&w=3840&q=75)
![ATR effects on cardiomyocyte electrophysiology. (A) Action potentials in response to electrical pacing were imaged optically (using di4-ANBDQBS) and presented as mean ± SEM at each point for each group. (B) Quantified APD80 for control CM and ChR2-CM without ATR and with 1 μM ATR (highest optical excitability). Both A and B had n = 3–4 samples per experimental group. (C) Calcium transients in response to electrical pacing were imaged optically (using Rhod4-AM) and presented as mean ± SEM at each point for each group. (D) Quantified CTD80 for control CM and ChR2-CM at different ATR supplements. Both C and D had n = 7–33 samples for each of the eight experimental groups. (E) Example activation maps of ChR2-CM, following point electrical stimulation at the bottom; isochrones are 10 ms apart. Scale bar is 5 mm. (F) Quantified conduction velocity from the activation maps (n = 7–14 per group). (*) indicates significant difference at p < 0.05 compared to the respective control (zero ATR) or as indicated by the brackets. Source: <strong>Cardiac Optogenetics: Enhancement by All-trans-Retinal </strong>by Yu et al., <em>Scientific Reports</em>, Nov. 2016.](/_next/image?url=https%3A%2F%2Fimages.aatbio.com%2Fproducts%2Ffigures-and-data%2Frhod-4-am%2Ffigure-for-rhod-4-am_HGqJh.jpg&w=3840&q=75)
![GPR157 couples with Gq-class of the heterotrimeric G-proteins. (A–C) Plasmids expressing indicated protein were transfected into U-2 OS cells. Rhod-4, a fluorescent calcium indicator, were used to assess changes in [Ca<sup>2+</sup>]i. Application of Ionomycin, a calcium ionopohore, to cells after experiments confirmed almost uniform uptake of Rhod-4 in these cells. (D–F) Fluorescent intensity of Rhod4 in GFP-positive cells. Mean ± s.e.m. Data were obtained from 3 independent experiments (more than 40 cells). **p < 0.01, ***p < 0.001. Scale bar: 10 μm. Source: <strong>The G protein-coupled receptor GPR157 regulates neuronal differentiation of radial glial progenitors through the Gq-IP3 pathway </strong>by Takeo et al., <em>Scientific Reports</em>, May 2016.](/_next/image?url=https%3A%2F%2Fimages.aatbio.com%2Fproducts%2Ffigures-and-data%2Frhod-4-am%2Ffigure-for-rhod-4-am_NeyL7.jpg&w=3840&q=75)
![Nuclear calcium transients in neonatal rat ventricular cardiomyocytes (NRVCs) exposed to hypertrophic stimuli. A. Original recording of only cytoplasmic Ca<sup>2+</sup> transients in NRVC with fluo-4. B. Line scan imaging of only cytoplasmic Ca<sup>2+</sup> transients in cardiomyocytes with fluo-4. C. Original recording of only nucleus Ca<sup>2+</sup> transients in cardiomyocytes with fluo-4. D. Line scan imaging of cytoplasmic Ca<sup>2+</sup> transients in cardiomyocytes with fluo-4. E. Original recording of cytoplasmic and nucleus Ca<sup>2+</sup> transients in NRVC with a different Ca indicator, Rhod-4. F. Line scan imaging of only cytoplasmic Ca<sup>2+</sup> transients in cardiomyocytes with Rhod-4. G. Line scan imaging of nuclear Ca<sup>2+</sup> transients in cardiomyocytes with Rhod-4. H. Average values of the effects of hypertrophic stimuli on time to F/F0 in the cytoplasm of NRVCs exposed to vehicle (control; n = 19), Ang II (n = 42), ET-1 (n = 21), or PE (n = 29). I. Average values of the effects by hypertrophic stimuli on time to F/F0 in the nucleus of NRVCs exposed to vehicle (control; n = 19), Ang II (n = 42), ET-1 (n = 21), or PE (n = 29). *P < 0.05 compared to the control. **P < 0.01 compared to the control. †P < 0.001 compared to the control. Source: <strong>Emerin plays a crucial role in nuclear invagination and in the nuclear calcium transient</strong> by Shimojima et al., <em>Scientific Reports,</em> March 2017.](/_next/image?url=https%3A%2F%2Fimages.aatbio.com%2Fproducts%2Ffigures-and-data%2Frhod-4-am%2Ffigure-for-rhod-4-am_LOQes.jpg&w=3840&q=75)
![Response to optical stimulation in light-sensitive cardiac syncytia. (a,b) Activation maps resulting from optical stimulation (1 Hz) of <em>in vitro</em> light-sensitive cell monolayers in the island configuration. Optical stimulus strength was at most 0.07 mW/mm<sup>2</sup> greater than the threshold irradiance required to elicit a propagating response (E<sub>e,thr</sub>). Time zero corresponds to the beginning of a 20 ms-long pulse of blue light (wavelength λ = 470 nm) applied to the 1 cm-diameter region indicated by the dashed black line in (a); spacing between isochrones is 10 ms. (c,d) Same as (a,b) but for <em>in silico</em> cell monolayers. Simulated optical stimuli were at most 0.0005 mW/mm<sup>2</sup> greater than E<sub>e,thr</sub>. Here time zero corresponds to the end of each 20 ms-long illumination pulse instead of the beginning; spacing between isochrones is 10 ms. Black-coloured locations did not activate. (e,f) Select <em>in vitro </em>calcium transients from the pixel locations 1–4 indicated in (a,b) on opposite sides of the island of ChR2-expressing donor cells (CM in GD and HEK in CD) showing the wavefront activation sequence. (g,h) Select <em>in silico</em> voltage traces (analogous to those in (e,f)) from locations 1–4. Source:<strong> Optogenetics-enabled assessment of viral gene and cell therapy for restoration of cardiac excitability</strong> by Ambrosi et al., <em>Scientific Reports</em>, Dec. 2015.](/_next/image?url=https%3A%2F%2Fimages.aatbio.com%2Fproducts%2Ffigures-and-data%2Frhod-4-am%2Ffigure-for-rhod-4-am_s7uYQ.jpg&w=3840&q=75)
![Conduction properties of light-sensitive cardiac syncytia. (a,b) Activation maps during electrical stimulation (1 Hz) of <em>in vitro</em> (a) and <em>in silico</em> (b) light-sensitive cell monolayers with distribution types (I, UL, UH) and delivery mode (GD, CD). In all cases, time zero corresponds to the start of the electrical stimulus; black coloured locations did not activate. For <em>in vitro</em> cases, the asterisk (*) marks the location of the bipolar pacing electrode and the spacing between isochrones lines is 10 ms. For <em>in silico</em> cases, the dashed rectangle indicates the area where transmembrane current stimulus was applied. (c) <em>In vitro</em> calcium transients at 1 Hz electrical pacing, plotted overlaid as group mean ± SEM, for control CMs, ChR2-expressing CMs (GD-UH), and co-cultures of CMs and ChR2-expressing HEK cells (CD-UL) (n = 5 per group); no significant differences. (d) Select calcium transients from the pixel locations 1–3 indicated in ((a), GD-UL and CD-UL) showing <em>in vitro</em> wavefront propagation across the monolayer. (e) Select voltage traces (analogous to those in (c)) from the pixel locations 1–6 indicated in (b, GD-UL and CD-UL) showing <em>in silico</em> wavefront propagation and upstroke morphology. Source: <strong>Optogenetics-enabled assessment of viral gene and cell therapy for restoration of cardiac excitability</strong> by Ambrosi et al., <em>Scientific Reports,</em> Dec. 2015.](/_next/image?url=https%3A%2F%2Fimages.aatbio.com%2Fproducts%2Ffigures-and-data%2Frhod-4-am%2Ffigure-for-rhod-4-am_FQJse.jpg&w=3840&q=75)
Citations
Authors: Steiner, Katharina and Humpel, Christian
Journal: Frontiers in Bioscience-Landmark (2024): 232
Authors: Liu, Wei and Han, Julie L and Tomek, Jakub and Bub, Gil and Entcheva, Emilia
Journal: ACS Photonics (2023)
Authors: Smith, Alyson S and Ankam, Soneela and Farhy, Chen and Fiengo, Lorenzo and Basa, Ranor CB and Gordon, Kara L and Martin, Charles T and Terskikh, Alexey V and Jordan-Sciutto, Kelly L and Price, Jeffrey H and others,
Journal: Journal of Pharmacological and Toxicological Methods (2022): 107157
Authors: Tellios, Vasiliki and Maksoud, Matthew JE and Lu, Wei-Yang
Journal: Glia (2022)
Authors: Demirel, Eda and Arnold, Caroline and Garg, Jaspal and J{\"a}ger, Marius Andreas and Sticht, Carsten and Li, Rui and Kuk, Hanna and Wettschureck, Nina and Hecker, Markus and Korff, Thomas
Journal: Cells (2021): 1748
Authors: Routhier, Julie and Pons, St{\'e}phanie and Freidja, Mohamed Lamine and Dalstein, V{\'e}ronique and Cutrona, J{\'e}r{\^o}me and Jonquet, Antoine and Lalun, Nathalie and M{\'e}rol, Jean-Claude and Lathrop, Mark and Stitzel, Jerry A and others,
Journal: Nature communications (2021): 1--13
Authors: Maksoud, Matthew JE and Tellios, Vasiliki and Xiang, Yun-Yan and Lu, Wei-Yang
Journal: Nitric Oxide (2021): 28--39
Authors: Chua, Christianne J and Han, Julie L and Li, Weizhen and Liu, Wei and Entcheva, Emilia
Journal: bioRxiv (2021)
Authors: Smith, Alyson S and Ankam, Soneela and Farhy, Chen and Fiengo, Lorenzo and Basa, Ranor CB and Gordon, Kara L and Martin, Charles T and Terskikh, Alexey V and Jordan-Sciutto, Kelly L and Price, Jeffrey H and others,
Journal: bioRxiv (2021): 2020--09
Authors: Urata, Shuzo and Yasuda, Jiro and Iwasaki, Masaharu
Journal: Viruses (2021): 869
References
Authors: Territo PR, Heil J, Bose S, Evans FJ, Balaban RS.
Journal: Appl Spectrosc (2007): 138
Authors: Stamm C, del Nido PJ.
Journal: Thorac Cardiovasc Surg (2004): 127
Authors: Martin VV, Beierlein M, Morgan JL, Rothe A, Gee KR.
Journal: Cell Calcium (2004): 509
Authors: Bednar B, Cunningham ME, Kiss L, Cheng G, McCauley JA, Liverton NJ, Koblan KS.
Journal: J Neurosci Methods (2004): 247
Authors: Stamm C, Friehs I, Choi YH, Zurakowski D, McGowan FX, del Nido PJ.
Journal: Cardiovasc Res (2003): 695
Authors: Du C, MacGowan GA, Farkas DL, Koretsky AP.
Journal: Biophys J (2001): 549
Authors: Du C, MacGowan GA, Farkas DL, Koretsky AP.
Journal: Cell Calcium (2001): 217
Authors: Lannergren J, Westerblad H, Bruton JD.
Journal: J Muscle Res Cell Motil (2001): 265
Authors: MacGowan GA, Du C, Glonty V, Suhan JP, Koretsky AP, Farkas DL.
Journal: J Biomed Opt (2001): 23
Authors: Muriel MP, Lambeng N, Darios F, Michel PP, Hirsch EC, Agid Y, Ruberg M.
Journal: J Comp Neurol (2000): 297
Application notes
A New Red Fluorescent & Robust Screen Quest™ Rhod-4™ Ca2+Indicator for Screening GPCR & Ca2+ Channel Targets
Quest Rhod-4™ Calcium Detection Reagents and Screen Quest™ Rhod-4 NW Calcium Assay Kits
What's A Ratiometric Indicator
A Meta-Analysis of Common Calcium Indicators
FAQ
How is intracellular calcium measured?
Are there any calcium indicators that don't require probenecid (PBC)?
Are there any substitutes for probenecid in calcium assays?
Can I intracellularly measure mitochondria calcium flux and changes in mitochondria membrane potential at the same time?