Products
Services
Resources
Selection Guides
About
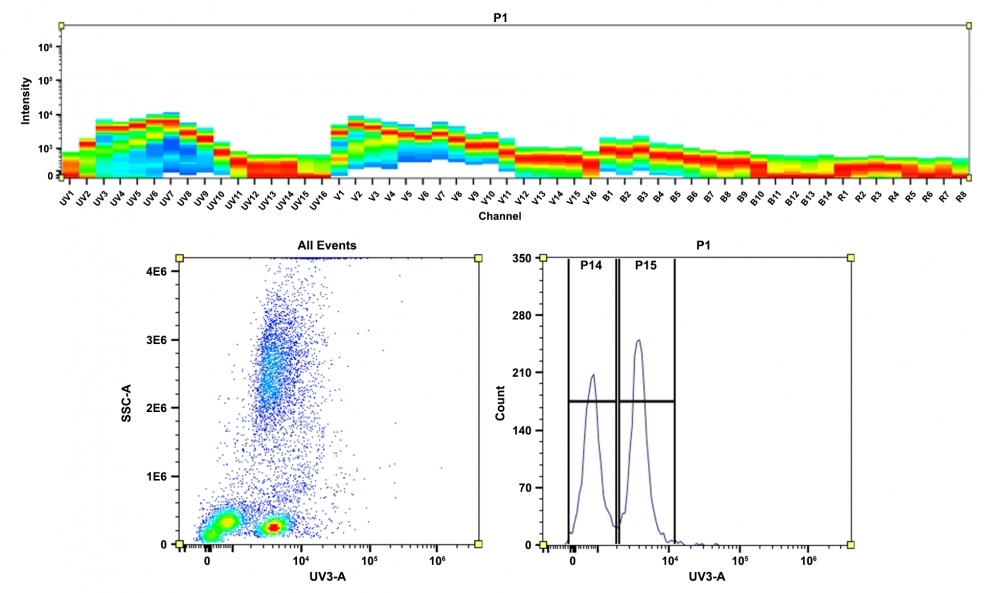
mFluor™ UV420 maleimide
mFluor™ dyes are engineered for advanced multicolor flow cytometry applications, offering significant Stokes Shifts and optimal excitation by standard flow cytometer laser lines, such as 350 nm, 405 nm, 488 nm, and 633 nm. The mFluor™ UV420 dye, which exhibits a bright blue fluorescence and moderate photostability, is ideally suited for excitation at the 350 nm laser line, with an emission maximum at ~420 nm. This maleimide derivative is commonly used for the conjugation of thiol groups on proteins, oligonucleotide thiophosphates, and low molecular weight ligands, producing conjugates that exhibit significantly brighter fluorescence and enhanced photostability compared to those formed with other spectrally similar fluorophores.
| Catalog | Size | Price | Quantity |
|---|---|---|---|
| 1603 | 1 mg | Price |

Physical properties
| Molecular weight | 1208.45 |
| Solvent | DMSO |
Spectral properties
| Absorbance (nm) | 352 |
| Extinction coefficient (cm -1 M -1) | 75000 1 |
| Excitation (nm) | 353 |
| Emission (nm) | 421 |
Storage, safety and handling
| H-phrase | H303, H313, H333 |
| Hazard symbol | XN |
| Intended use | Research Use Only (RUO) |
| R-phrase | R20, R21, R22 |
| Storage | Freeze (< -15 °C); Minimize light exposure |
| UNSPSC | 12171501 |
Contact us
| Telephone | |
| Fax | |
| sales@aatbio.com | |
| International | See distributors |
| Bulk request | Inquire |
| Custom size | Inquire |
| Technical Support | Contact us |
| Request quotation | Request |
| Purchase order | Send to sales@aatbio.com |
| Shipping | Standard overnight for United States, inquire for international |
Page updated on July 6, 2026