Fundamentals of Flow Cytometry
Introduction
Flow cytometry is a powerful and flexible technique that can rapidly analyze multiple parameters of individual cells, within heterogeneous cell populations. Flow cytometers are utilized in a range of applications, from immuno-phenotyping, ploidy analysis and cell counting, to fluorescence-activated cell sorting (FACs), fluorescence expression analysis, and more. The flow cytometer performs this analysis by passing thousands of cells per second through a laser beam and capturing the fluorescence and scattered light that emerges from each cell. As the cells pass through, fluorescence data is collected and analyzed statistically by flow cytometry software to report cellular characteristics including size, complexity, phenotype and health (e.g. viability, proliferation and apoptotic states).
The principle behind fluorescence is that any fluorophore has a range of specific wavelengths at which it absorbs light energy. In absorption, high energy light excites fluorophores to a higher energy level called an excited state. Once this state is achieved, fluorophores return to a low energy ground state by releasing the excess energy in the form of light. This transition of energy is called fluorescence.
Fluorescence is an important feature of fluorophores as it is used to differentiate their color, that is, the wavelength at which they emit fluorescent light. The ability to simultaneously utilize multiple fluorophore-conjugates with distinct and well-separated emission profiles permits multi-parametric analysis, which is the real power of flow cytometry. However, one of the biggest challenges in multi-parameter flow cytometry is knowing the correct combination of fluorophores to select in order to maximize assay sensitivity. Keep in mind, with the right combination one can minimize tedious compensation and spillover adjustments with no sacrifice to the quality and accuracy to the data collected. So how does one choose the optimal combination of fluorophores? The answer lies within the instrument.
What is a Flow Cytometer?
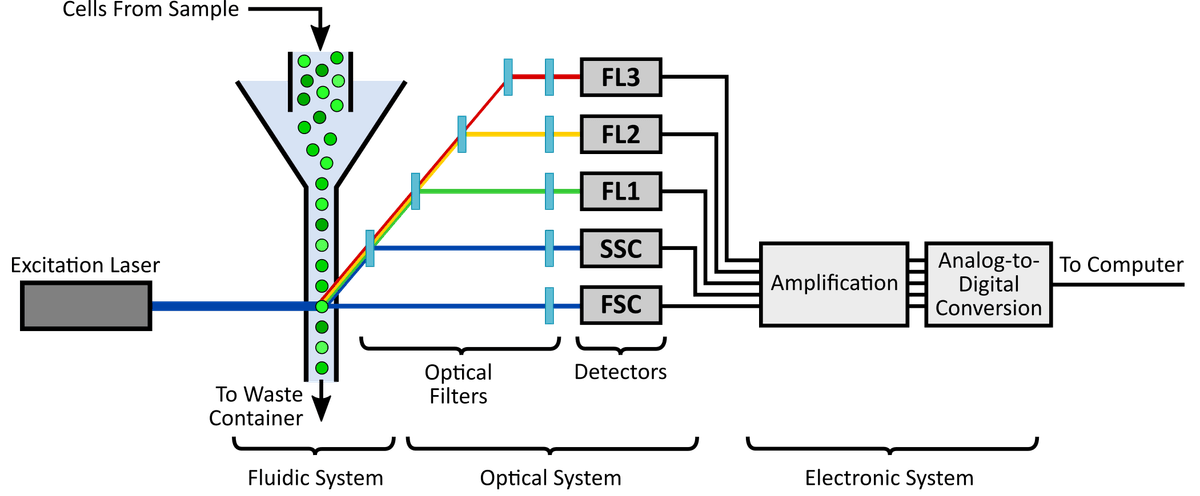
Schematically, the flow cytometer is comprised of three key systems: the fluidic, the optical and electronic system (Figure 1).
The fluidic system is responsible for transporting cells. It passes cells individually through pressurized lines containing sheath fluid to the interrogation point where the laser intersects with the sample. The sample flow rate of the fluidic system can be manipulated in order to improve analysis. For example, a slow flow rate decreases the size of the sample stream, thereby increasing the accuracy and uniformity of sample detection.
The optical system is responsible for illumination and light collection within the flow cytometer. This system is comprised of excitation lasers, lenses and filters. The lasers ensure that cells in the interrogation point are excited with uniform light of a specific wavelength. For instance, argon lasers emit light at the 488 nm wavelength and can be used to excite fluorophores with a 488 nm absorption maximum such as iFluor® 488 (Cat# 1023) and FITC (Cat# 135).
As the cells pass through the laser it emits fluorescence and scattered laser light at all angles. The collection optics " lenses and filters " serve to separate and direct the specific wavelengths of fluorescence and scattered laser light to the appropriate detectors. These detectors capture the emitted fluorescence and scattered laser lights, converts them into a photocurrent and passes it to the electronics system to be digitized and processed for subsequent analysis.
Since its introduction in the 1970s till today, flow cytometers have evolved significantly. Early designs consisted of single-laser cytometers that could only detect size. While todays cytometers feature multiple laser and filter configurations to facilitate multicolor analysis, with some cytometers capable of detecting up to 14 parameters simultaneously. Therefore, when choosing the appropriate fluorophores for multicolor analysis, instrument configuration " more importantly the lasers and filters " must be taken into careful consideration.
Choosing the Correct Fluorophore(s)
Before choosing any fluorophores, consider the following: (1) the type of laser(s) equipped in the flow cytometer, (2) the number of lasers present, (3) the excitation capabilities of each laser, and (4) how to appropriately configure filters. Step four is critical to assay sensitivity, setting a filter too wide may lead to excess background noise and false results.
Next, is to select the appropriate fluorophores. Criteria to consider when selecting fluorophores for multicolor flow cytometry include:
- Strong fluorescence as characterized by high extinction coefficient and quantum yield
- Excitation and emission maxima carefully matched to instrument laser and filter configuration
- Well-separated emission profile to minimize spectral overlap and spillover
- Large Stokes shift " critical in multiplexing analysis as the higher the value the greater the separation
Another good rule of thumb is to choose robust dye colors, as these will determine how prominent the signal is over the unstained cell population. However in some cases, it may make more sense to choose a dimer dye in order to avoid spillover and preserve resolution and sensitivity.
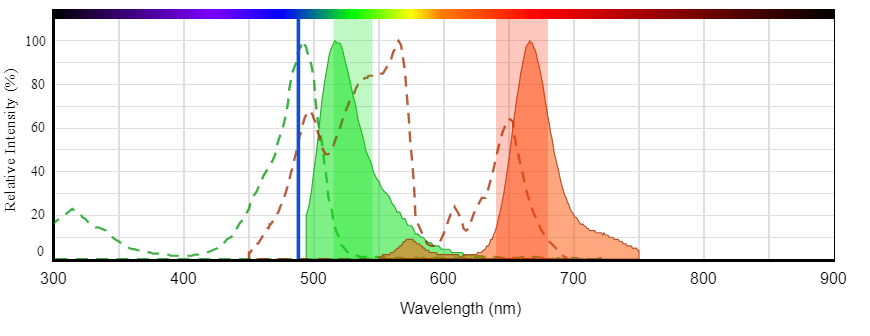
For assistance building multicolor flow cytometry panels use AAT Bioquest's Fluorescence Spectrum Viewer. This web-based tool allows users to specify instrument configuration (e.g. laser and filter setting) in order to check fluorophore compatibility. It can also be used to determine if two fluorophores have spectral overlap and if compensation will be required (Figure 2).
Excitation and emission spectrum of iFluor® 488 (Cat# 1023, green) and PE-Cy5 tandem (Cat# 2610, red) illustrating the clear spectral separation that enables multicolor analysis. Both iFluor® 488 and PE-Cy5 can be efficiently excited by the 488 nm laser.
The following is an example of a combination of fluorophores for a 6-color panel, these include: iFluor™ 488 (Cat# 1023), PE (Cat# 2558), PE-Cy5.5 (Cat# 2613), PE-Cy7 (Cat# 2616), APC (Cat# 2554) or iFluor® 647 (Cat# 1031), and APC-Cy7 (Cat# 2625) (Table 1). These fluorophores are subsequently conjugated to an antibody target of choice and can be utilized in FACS or immunophenotyping. AAT Bioquest offers two easy-to-use antibody conjugation kits, ReadiLink™ Kits and Buccutite™ Kits, in a wide range of fluorescent labels, phycobiliproteins and tandem dyes compatible with any flow cytometer configuration. In addition, AAT Bioquest offers an array of high quality reagents for flow cytometry, some of which, including protocols, are highlighted below.
Table 1. Six Color Flow Cytometry Panel
| Cat# ▲ ▼ | Product Name ▲ ▼ | Ex (nm) ▲ ▼ | Em (nm) ▲ ▼ | Stokes Shift (nm) ▲ ▼ |
| 1023 | iFluor® 488 succinimidyl ester | 491 | 518 | 27 |
| 2558 | PE [R-Phycoerythrin] *CAS 11016-17-4* | 565 | 575 | 10 |
| 2613 | PE-Cy5.5 Tandem | 565 | 700 | 135 |
| 2616 | PE-Cy7 Tandem | 565 | 780 | 215 |
| 2554 | APC [Allophycocyanin] | 651 | 662 | 11 |
| 1031 | iFluor® 647 succinimidyl ester | 649 | 664 | 15 |
| 2625 | APC-Cy7 Tandem | 651 | 780 | 129 |
Cell Surface and Intracellular Staining for Flow Cytometry
Flow cytometry is an extremely useful technique which can be used to analyze various cell surface and intracellular components. In the following section, we discuss flow cytometric reagents and protocols for cell surface and intracellular staining.
Staining Cell Surface Biomarkers
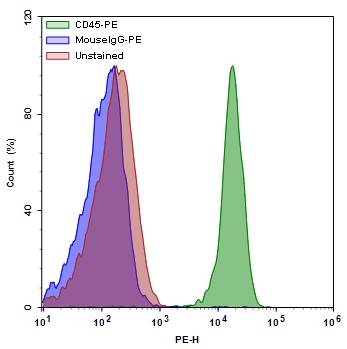
Single parameter histogram of lymphocytes isolated from PBMCs. The PBMCs were labelled with CD45 antibody tagged with PE (1µg/mL) for cell surface antigens. The labelled cells were gated on lymphocytes and analysed by ACEA NovoCyte flow cytometer.
When cell surface staining, consider the following:
- Prepare the desired biological cells according to the appropriate protocol.
- Wash cells with PBS buffer to remove excess cell culture medium.
- Reduce non-specific interactions by treating cells with a blocking agent such as 1% fetal bovine serum or BSA.
- After blocking, stain cell surface antigens with fluorescently labeled antibody conjugates.
- Wash cells at least twice with desired buffer.
- Re-suspend cells in ice-cold PBS and analyze using flow cytometer
Figure 3 shown above, illustrates cell surface staining utilizing the aforementioned considerations. In this example, peripheral blood mononuclear cells (PBMCs) were labeled with cell surface antibody CD45 conjugated with phycoerythrin (PE). Cells were incubated with Fc StainX (Biolegend) for 20 minutes at room temperature to block non-specific interaction. Following blocking, cells were incubated with CD45-PE conjugates for 20 minutes on ice, protected from light. Cells were then washed with PBS buffer, re-suspended in stain buffer and analyzed using an ACEA NovoCyte flow cytometer.
Staining for intracellular targets
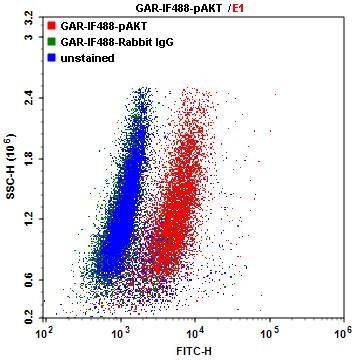
Single parameter dot plot of Jurkat cells. The Jurkat cells were labelled with p-AKT antibody followed by Goat Anti-Rabbit tagged with iF488 (5µg/mL) for intracellular staining. The labelled cells were analyzed by ACEA NovoCyte flow cytometer.
Figure 4 shown above, illustrates intracellular staining utilizing iFluor 488-secondary conjugates. In this example, Jurkat cells were fixed with 100% Methanol for 30 minutes at -20°C. Cells were then washed with wash buffer and blocked using PBST containing 1% BSA for 30 minutes at room temperature to reduce non-specific binding of the antibodies. After blocking, cells were incubated with p-Akt or Rabbit IgG for 60 minutes at room temperature, and then washed with wash buffer. Next, iFluor 488 goat anti-rabbit secondary antibodies were added for 30 minutes at room temperature, protected from light. Cells were then washed with wash buffer, re-suspended in stain buffer and analyzed using an ACEA NovoCyte flow cytometer.
Tracking Cell Proliferation by Flow Cytometry
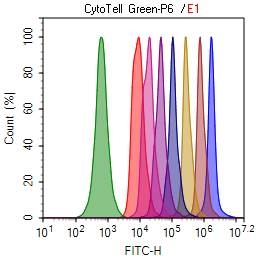
Cell tracking assay with CytoTell™ Green. Jurkat cells (2 x 10⁶) were plated and stained with CytoTell™ Green dyes on day 0. The cells were passed serially at 1:1 ratio and passaged for 9 days. Fluorescence intensity was measured using NovoCyte flow cytometer from ACEA Biosciences, Inc. Successive generations were represented by different colors.
The CytoTell dyes (Figure 5) were created with the aforementioned criteria in mind. Similar to CFSE, CytoTell™ dyes are cell-permeable indicators that react with cytoplasmic proteins through lysine residues and other amine sources, producing high fluorescent, cell-impermeant proteins. The resulting covalent bond ensures CytoTell™ dyes are not transferred to adjacent cells and are well-retained in cells for several generations. As cells divide, CytoTell™ fluorescent proteins are equally distributed between daughter cells during cell division, and each new generation of cells is marked by a fluorescence intensity half that of its parents, which is readily detectable by flow cytometry.
Compared to CFSE, CytoTell™ dyes have minimal cytotoxicity and better cellular retention. CytoTell™ dyes, other than CytoTell™ Green, are excellent for multicolor applications with either GFP cell lines or iFluor 488™-labeled antibodies.
Product Ordering Information
Table 3. ReadiLink™ Rapid iFluor® Antibody Labeling Kits
| ReadiLink™ Antibody Labeling Kit ▲ ▼ | Fluorophore Equivalent ▲ ▼ | Ex/Em (nm) ▲ ▼ | Imaging ▲ ▼ | Flow Cytometry ▲ ▼ | Cat No. ▲ ▼ |
| ReadiLink™ Rapid iFluor® 350 | AMCA, Alexa Fluor® 350 | 344/448 | Yes | 1220 | |
| ReadiLink™ xtra Rapid iFluor® 350 | AMCA, Alexa Fluor® 350 | 344/448 | Yes | 1950 | |
| ReadiLink™ Rapid iFluor® 488 | FITC, Alexa Fluor® 488 | 491/516 | Yes | Yes | 1255 |
| ReadiLink™ xtra Rapid iFluor® 488 | FITC, Alexa Fluor® 488 | 491/516 | Yes | Yes | 1955 |
| ReadiLink™ Rapid iFluor® 555 | Cy3, Alexa Fluor® 555 | 556/569 | Yes | 1227 | |
| ReadiLink™ xtra Rapid iFluor® 555 | Cy3, Alexa Fluor® 555 | 556/569 | Yes | 1958 | |
| ReadiLink™ Rapid iFluor® 594 | Texas Red®, Alexa Fluor® 594 | 587/603 | Yes | 1230 | |
| ReadiLink™ xtra Rapid iFluor® 594 | Texas Red®, Alexa Fluor® 594 | 587/603 | Yes | 1960 | |
| ReadiLink™ Rapid iFluor® 633 | Cy5, Alexa Fluor® 633 | 638/655 | Yes | Yes | 1260 |
| ReadiLink™ Rapid iFluor® 647 | Cy5, Alexa Fluor® 647 | 654/669 | Yes | Yes | 1235 |
References
- Adan, A., Alizada, G., Kiraz, Y., Baran, Y. & Nalbant, A. Flow cytometry: basic principles and applications. Critical Rev. Biotechnol. 37, 163"176.
- Davies D. (2010). Cell sorting by flow cytometry. In: Macey MG, ed. Flow cytometry: principles and applications. Totowa (NJ): Humana Press, 257"76
- Macey MG. (2010). Principles of flow cytometry. Flow cytometry: principles and applications In: Macey MG, ed. Totowa (NJ): Humana Press, 1"15
- Wlodkowic D, Skommer J, Darzynkiewicz Z. (2009). Flow cytometry-based apoptosis detection. Methods Mol Biol, 559, 19"32
- Errante, Paolo. (2016). Flow cytometry: a literature review. 10.13140/RG.2.1.2461.0969
- Laerum, O. D. and Farsund, T. (1981), Clinical application of flow cytometry: A review. Cytometry, 2: 1-13. doi:10.1002/cyto.990020102
- Wood, J.C.S. and Hoffman, R.A. (1998) Evaluating fluorescence sensitivity on flow cytometers: an overview. Cytometry, 33: 256-259.
- Van Dilla, M.A., Dean, P.N., Laerum, O.D. and Melamed, M.R. (eds.) (1985). Flow cytometry instrumentation and data analysis. Academic Press, Orlando.
- Wood, J.C.S. (1993). Clinical Flow Cytometry Instrumentation. In: Clinical Flow Cytometry. Principles and Applications. (eds. Bauer, K.D, Duque, R.E. and Shankey, T.V.), pp. 71-92. Williams and Wilkins, Baltimore.

