logo
AAT Bioquest

Calbryte™ 630 AM

Calcium measurement is critical for numerous biological investigations. Fluorescent probes that show spectral responses upon binding calcium have enabled researchers to investigate changes in intracellular free calcium concentrations by using fluorescence microscopy, flow cytometry, fluorescence spectroscopy and fluorescence microplate readers. x-Rhod-1 is commonly used as a red fluorescent calcium indicator. However, x-Rhod-1 is only moderately fluorescent in live cells upon esterase hydrolysis, and has very small cellular calcium responses. Calbryte™ 630 has been developed to improve x-Rhod-1 cell loading and calcium response while maintaining the spectral wavelength of x-Rhod-1, making it compatible with Texas Red® filter set. In CHO and HEK cells Cal-630™ AM has cellular calcium response that is much more sensitive than x-Rhod-1. The spectra of Calbryte™ 630 is well separated from those of FITC, Alexa Fluor® 488 and GFP, making it an ideal calcium probe for multiplexing intracellular assays with GFP cell lines or FITC/Alexa Fluor® 488 labeled antibodies. Calbryte™ 630 is a new generation of red fluorescent indicators for the measurement of intracellular calcium. Its greatly improved signal/background ratio and intracellular retention properties make Calbryte™ 630 AM the most robust deep red fluorescent indicator for evaluating GPCR and calcium channel targets as well as for screening their agonists and antagonists in live cells. Like other dye AM cell loading, Calbryte™ 630 AM ester is non-fluorescent and once gets inside the cell, it is hydrolyzed by intracellular esterase and gets activated. The activated indicator is a polar molecule that is no longer capable of freely diffusing through cell membrane, essentially trapped inside cells.
Example protocol

PREPARATION OF STOCK SOLUTIONS

Unless otherwise noted, all unused stock solutions should be divided into single-use aliquots and stored at -20 °C after preparation. Avoid repeated freeze-thaw cycles

Calbryte™ 630 AM Stock Solution
  1. Prepare a 2 to 5 mM stock solution of Calbryte™ 630 AM in anhydrous DMSO.

    Note: When reconstituted in DMSO, Calbryte™ 630 AM is a clear, colorless solution.

PREPARATION OF WORKING SOLUTION

Calbryte™ 630 AM Working Solution
  1. On the day of the experiment, either dissolve Calbryte™ 630 AM in DMSO or thaw an aliquot of the indicator stock solution to room temperature.

  2. Prepare a 2 to 20 µM Calbryte™ 630 AM working solution in a buffer of your choice (e.g., Hanks and Hepes buffer) with 0.04% Pluronic® F-127. For most cell lines, Calbryte™ 630 AM at a final concentration of 4-5 μM is recommended. The exact concentration of indicators required for cell loading must be determined empirically.

    Note: The nonionic detergent Pluronic® F-127 is sometimes used to increase the aqueous solubility of Calbryte™ 630 AM. A variety of Pluronic® F-127 solutions can be purchased from AAT Bioquest.

    Note: If your cells contain organic anion-transporters, probenecid (1-2 mM) may be added to the dye working solution (final in well concentration will be 0.5-1 mM) to reduce leakage of the de-esterified indicators. A variety of ReadiUse™ Probenecid products, including water-soluble, sodium salt, and stabilized solutions, can be purchased from AAT Bioquest.

SAMPLE EXPERIMENTAL PROTOCOL

Following is our recommended protocol for loading AM esters into live cells. This protocol only provides a guideline and should be modified according to your specific needs.

  1. Prepare cells in growth medium overnight.
  2. On the next day, add 1X Calbryte™ 630 AM working solution into your cell plate.

    Note: If your compound(s) interfere with the serum, replace the growth medium with fresh HHBS buffer before dye-loading.

  3. Incubate the dye-loaded plate in a cell incubator at 37 °C for 30 to 60 minutes.

    Note: Incubating the dye for longer than 1 hour can improve signal intensities in certain cell lines.

  4. Replace the dye working solution with HHBS or buffer of your choice (containing an anion transporter inhibitor, such as 1 mM probenecid, if applicable) to remove any excess probes.
  5. Add the stimulant as desired and simultaneously measure fluorescence using either a fluorescence microscope equipped with a Texas Red filter set or a fluorescence plate reader containing a programmable liquid handling system such as an FDSS, FLIPR, or FlexStation, at Ex/Em = 600/640 nm cutoff 630 nm.

Calculators

Common stock solution preparation

Table 1. Volume of DMSO needed to reconstitute specific mass of Calbryte™ 630 AM to given concentration. Note that volume is only for preparing stock solution. Refer to sample experimental protocol for appropriate experimental/physiological buffers.

0.1 mg0.5 mg1 mg5 mg10 mg
1 mM80.982 µL404.911 µL809.822 µL4.049 mL8.098 mL
5 mM16.196 µL80.982 µL161.964 µL809.822 µL1.62 mL
10 mM8.098 µL40.491 µL80.982 µL404.911 µL809.822 µL

Molarity calculator

Enter any two values (mass, volume, concentration) to calculate the third.

Mass (Calculate)Molecular weightVolume (Calculate)Concentration (Calculate)Moles
/=x=

Spectrum

Product family

NameExcitation (nm)Emission (nm)Quantum yield
Calbryte™ 520 AM4935150.751
Calbryte™ 590 AM581593-
Calbryte™-520L AM4935150.751
Calbryte™-520XL AM4935150.751
Cal-630™ AM6096260.371

Citations

View all 29 citations: Citation Explorer
A platform of functional studies of ESCC-associated gene mutations identifies the roles of TGFBR2 in ESCC progression and metastasis
Authors: Wang, Jian and Du, Jiajia and Luo, Xiangmeng and Guo, Linjie and Liu, Yixin and Zhou, Jianfeng and Zou, Yang and Lu, Zhenghao and Pan, Xiangyu and Chen, Xuelan and others,
Journal: Cell Reports (2024)
SelK promotes glioblastoma cell proliferation by inhibiting $\beta$-TrCP1 mediated ubiquitin-dependent degradation of CDK4
Authors: Li, Jizhen and Zhao, Lingling and Wu, Zerui and Huang, Shirui and Wang, Junyu and Chang, Yuanyuan and Liu, Li and Jin, Honglei and Lu, Jianglong and Huang, Chuanshu and others,
Journal: Journal of Experimental \& Clinical Cancer Research (2024): 231
The endoplasmic reticulum plays a key role in $\alpha$-cell intracellular Ca2+ dynamics and glucose-regulated glucagon secretion in mouse islets
Authors: Acreman, Samuel and Ma, Jinfang and Denwood, Geoffrey and Gao, Rui and Tarasov, Andrei and Rorsman, Patrik and Zhang, Quan
Journal: iScience (2024)
Tuft cell IL-17RB restrains IL-25 bioavailability and reveals context-dependent ILC2 hypoproliferation
Authors: Feng, Xiaogang and Andersson, Tilde and Gschwend, Julia and Fl{\"u}chter, Pascal and Berest, Ivan and Muff, Julian L and Carchidi, Daniele and Lechner, Antonie and de Tenorio, Jeshua C and Brander, Nina and others,
Journal: bioRxiv (2024): 2024--03
FTO-mediated m6A demethylation regulates GnRH expression in the hypothalamus via the PLC$\beta$3/Ca2+/CAMK signalling pathway
Authors: Zang, Shaolian and Yin, Xiaoqin and Li, Pin
Journal: Communications Biology (2023): 1297

References

View all 53 references: Citation Explorer
A flow cytometric comparison of Indo-1 to fluo-3 and Fura Red excited with low power lasers for detecting Ca(2+) flux
Authors: Bailey S, Macardle PJ.
Journal: J Immunol Methods (2006): 220
Functional fluo-3/AM assay on P-glycoprotein transport activity in L1210/VCR cells by confocal microscopy
Authors: Orlicky J, Sulova Z, Dovinova I, Fiala R, Zahradnikova A, Jr., Breier A.
Journal: Gen Physiol Biophys (2004): 357
Comparison of human recombinant adenosine A2B receptor function assessed by Fluo-3-AM fluorometry and microphysiometry
Authors: Patel H, Porter RH, Palmer AM, Croucher MJ.
Journal: Br J Pharmacol (2003): 671
Measurement of the dissociation constant of Fluo-3 for Ca2+ in isolated rabbit cardiomyocytes using Ca2+ wave characteristics
Authors: Loughrey CM, MacEachern KE, Cooper J, Smith GL.
Journal: Cell Calcium (2003): 1
A sensitive method for the detection of foot and mouth disease virus by in situ hybridisation using biotin-labelled oligodeoxynucleotides and tyramide signal amplification
Authors: Zhang Z, Kitching P.
Journal: J Virol Methods (2000): 187
Page updated on January 22, 2025

Ordering information

Price
AvailabilityIn stock
Unit size
2x50 ug
10x50 ug
1 mg
Catalog Number
207202072120722
Quantity
Add to cart

Additional ordering information

Telephone1-800-990-8053
Fax1-800-609-2943
Emailsales@aatbio.com
InternationalSee distributors
Bulk requestInquire
Custom sizeInquire
Technical SupportContact us
Purchase orderSend to sales@aatbio.com
ShippingStandard overnight for United States, inquire for international
Request quotation

Physical properties

Dissociation constant (Kd, nM)1200

Molecular weight

1234.84

Solvent

DMSO

Spectral properties

Excitation (nm)

607

Emission (nm)

624

Storage, safety and handling

Certificate of OriginDownload PDF
H-phraseH303, H313, H333
Hazard symbolXN
Intended useResearch Use Only (RUO)
R-phraseR20, R21, R22

Storage

Freeze (< -15 °C); Minimize light exposure
UNSPSC12352200

Platform

Flow cytometer

Excitation640 nm laser
Emission660, 20 nm filter
Instrument specification(s)APC channel

Fluorescence microscope

ExcitationTexas Red
EmissionTexas Red
Recommended plateBlack wall, clear bottom

Fluorescence microplate reader

Excitation600
Emission640
Cutoff630
Recommended plateBlack wall, clear bottom
Instrument specification(s)Bottom read mode, Programmable liquid handling
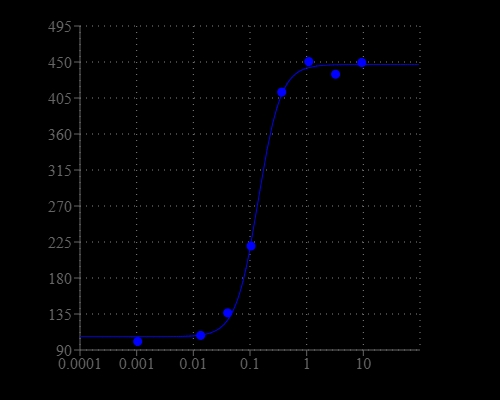
Graph illustrates signal-to-noise (SNR) x 100%. ATP dose response was measured in CHO-K1 cells with Calbryte&trade; 630 AM. CHO-K1 cells were seeded overnight at 50,000 cells/100 &micro;L/well in a 96-well black wall/clear bottom costar plate. 100 &micro;L of 10 &micro;g/ml Calbryte&trade; 630 AM in HH Buffer with probenecid was added and incubated for 60 min at 37&deg;C. Dye loading solution was then removed and replaced with 200 &micro;L HH Buffer/well. ATP  (50 &micro;L/well) was added by FlexStation 3 to achieve the final indicated concentrations.
The ATP induced intracellular calcium release was measured by Calbryte&trade; 630 AM. Cells were incubated with Calbryte&trade; 630 AM dye for 30 min at 37 &deg;C before 10 &micro;M ATP was added into the cells. The baseline was acquired and the rest of the cells were analyzed after the addition of ATP. The response was measured over time. The analysis was done on NovoCyte&trade; 3000 Flow Cytometer APC Channel.
a, b Overexpression of FTO (OE-FTO) in GT1-7 cells as confirmed by qPCR and western blotting (n = 3). c GnRH mRNA levels detected by qPCR in OE-FTO cells (n = 3). d GnRH abundance in OE-FTO cells as determined by ELISA (n = 3). e, f Knockdown of FTO (KD-FTO) in GT1-7 cells as determined by qPCR and western blotting (n = 3). g Expression of GnRH mRNA as determined by qPCR (n = 3). h Protein expression of GnRH in KD-FTO cells as determined by ELISA (n = 3). i Free Ca2+ concentrations of OE-Control and OE-FTO GT1-7 cells as determined by fluorescence of Calbryte-630 with flow cytometry as described in the Methods (n = 3). Left: flow cytometric histograms of Calbryte-630 and gating with no Calbryte-630 probe as background values. Right: quantitative analysis of cell fluorescence for Calbryte-630. j Levels of intracellular free Ca2+ (red colour) between OF-FTO and OE-Control cells as determined by IF (n = 6). The concentration of fluorescence-labelled Calbryte 630 was 5 μM. Scale bars, 100 μm. The bars represent the means ± SEMs. *P < 0.05, **P < 0.01, ***P < 0.001, and ns, P > 0.05 versus OE-control or KD-control group by Student’s t test. Source: <b>FTO-mediated m6A demethylation regulates GnRH expression in the hypothalamus via the PLCβ3/Ca2+/CAMK signalling pathway</b> by Zang, S., Yin, X. & Li, P. <em>Commun Biol 6, 1297</em> Dec. 2023.