Products
Services
Resources
Selection Guides
About
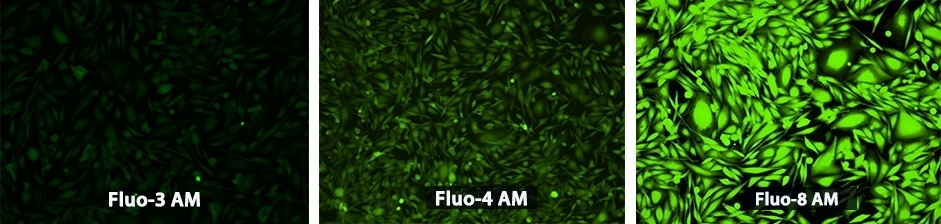
Fluo-8®, AM
Calcium measurements are critical for numerous biological investigations. Fluorescent probes that show spectral responses upon binding Ca2+ have enabled researchers to investigate changes in intracellular free Ca2+ concentrations by using fluorescence microscopy, flow cytometry, fluorescence spectroscopy, and fluorescence microplate readers. Fluo-3 AM and Fluo-4 AM are most commonly used among the visible light-excitable calcium indicators for live-cell calcium imaging. However, Fluo-3 AM and Fluo-4 AM are only moderately fluorescent in live cells upon esterase hydrolysis and require harsh cell loading conditions to maximize their cellular calcium responses. Fluo-8® dyes are developed to improve cell loading and calcium response while maintaining the convenient Fluo-3 and Fluo-4 spectral wavelengths of Ex/Em = ∼490/∼520 nm. Fluo-8® AM can be loaded into cells at room temperature, while Fluo-3 AM and Fluo-4 AM require 37°C for cell loading. In addition, Fluo-8® AM is two times brighter than Fluo-4 AM and four times brighter than Fluo-3 AM. AAT Bioquest offers a set of our outstanding Fluo-8® reagents with different calcium-binding affinities (Fluo-8® Kd = 389 nM; Fluo-8H™ Kd = 232 nM; Fluo-8L™ Kd = 1.86 µM; Fluo-8FF™ Kd = 10 µM). We also offer versatile packing sizes to meet your special needs (e.g., 1 mg, 10x50 µg, 20x50 µg, and HTS packages) with no additional packaging charge.
| Catalog | Size | Price | Quantity |
|---|---|---|---|
| 21080 | 1 mg | Price | |
| 21081 | 5x50 ug | Price | |
| 21082 | 10x50 ug | Price | |
| 21083 | 20x50 ug | Price |

Physical properties
| Dissociation constant (Kd, nM) | 389 |
| Molecular weight | 1046.93 |
| Solvent | DMSO |
Spectral properties
| Correction factor (260 nm) | 1.076 |
| Correction factor (280 nm) | 0.769 |
| Extinction coefficient (cm -1 M -1) | 23430 |
| Excitation (nm) | 495 |
| Emission (nm) | 516 |
| Quantum yield | 0.16 1 |
Storage, safety and handling
| H-phrase | H303, H313, H333 |
| Hazard symbol | XN |
| Intended use | Research Use Only (RUO) |
| R-phrase | R20, R21, R22 |
| Storage | Freeze (< -15 °C); Minimize light exposure |
| UNSPSC | 12352200 |
| CAS | 1345980-40-6 |
Instrument settings
| Fluorescence microscope | |
| Excitation | FITC |
| Emission | FITC |
| Recommended plate | Black wall/clear bottom |
| Fluorescence microplate reader | |
| Excitation | 490 |
| Emission | 525 |
| Cutoff | 515 |
| Recommended plate | Black wall/clear bottom |
| Instrument specification(s) | Bottom read mode/Programmable liquid handling |
Contact us
| Telephone | |
| Fax | |
| sales@aatbio.com | |
| International | See distributors |
| Bulk request | Inquire |
| Custom size | Inquire |
| Technical Support | Contact us |
| Request quotation | Request |
| Purchase order | Send to sales@aatbio.com |
| Shipping | Standard overnight for United States, inquire for international |
Page updated on June 24, 2026