logo
AAT Bioquest

Cell Meter™ JC-10 Mitochondrion Membrane Potential Assay Kit *Optimized for Flow Cytometry Assays*

Although JC-1 is widely used in many labs, its poor water solubility causes extraordinary inconvenience. Even at 1 µM concentration, JC-1 tends to precipitate in aqueous buffer. JC-10 is developed to be a superior alternative to JC-1 where high dye concentration is desired. Compared to JC-1, JC-10 has much better water solubility. JC-10 is capable of entering selectively into mitochondria, and changes reversibly its color from green to orange as membrane potentials increase. This property is due to the reversible formation of JC-10 aggregates upon membrane polarization that causes shifts in emitted light from 520 nm (i.e., emission of JC-10 monomeric form) to 570 nm (i.e., emission of J-aggregate). When excited at 490 nm, the color of JC-10 changes reversibly from green to greenish orange as the mitochondrial membrane becomes more polarized. Both colors can be detected using the filters commonly mounted in all flow cytometers, so that green emission can be analyzed in fluorescence channel 1 (FL1) and greenish orange emission in channel 2 (FL2). Besides its potential use in flow cytometry, it can also be used in fluorescence imaging and fluorescence microplate platform. This kit provides all the essential components with an optimized assay method for the detection of apoptosis in cells with the loss of mitochondrial membrane potential. This fluorometric assay is based on the detection of the mitochondrial membrane potential changes in cells by the cationic, lipophilic JC-10 dye. In normal cells, JC-10 concentrates in the mitochondrial matrix where it forms red fluorescent aggregates. However, in apoptotic and necrotic cells, JC-10 exists in monomeric form and stains cells in green fluorescence. The kit is optimized for screening of apoptosis activators and inhibitors by flow cytometry. We also offer a convenient 96-well and 384-well fluorescence microtiter-plate format kit (cat#22800) for high through put screening.
Example protocol

AT A GLANCE

Protocol summary

  1. Prepare cells with test compounds at the density of 5 × 10⁵ to 1 x 10⁶ cells/mL
  2. Resuspend the cells in 500 µL of JC-10 working solution (2-5 × 10⁵ cells/tube) 
  3. Incubate at 37°C or room temperature for 15-60 minutes
  4. Analyze with flow cytometer using FL1 channel (green fluorescence monomeric signal) and FL2 channel (orange fluorescence aggregated signal)

Important notes
Thaw all the kit components at room temperature before starting the experiment.

PREPARATION OF WORKING SOLUTION

Add 25 µL of 200X JC-10 (Component A) into 5 mL of Assay Buffer A (Component B) and mix well to make JC-10 working solution. Protect from light.

For guidelines on cell sample preparation, please visit
https://www.aatbio.com/resources/guides/cell-sample-preparation.html

SAMPLE EXPERIMENTAL PROTOCOL

  1. Treat cells with test compounds for a desired period of time to induce apoptosis. Set up parallel control experiments.

    For Negative Control: Treat cells with vehicle only.

    For Positive Control: Treat cells with FCCP or CCCP at 2-10  µM in a 37 oC, 5% CO2 incubator for 15 to 30 minutes. Note: CCCP or FCCP can be added simultaneously with JC-10 working solution. Titration of the CCCP or FCCP may be required for optimal results with an individual cell lines. 

  2. Centrifuge the cells to get 2 - 5 × 10⁵ cells per tube. Note: For adherent cells, gently lift the cells by 0.5 mM EDTA to remain the cells intake, and wash the cells once with serum-containing media prior to incubation with JC-10 working solution.

  3. Resuspend cells in 500 µL of JC-10 working solution.

  4. Incubate the cells at room temperature or in a 37 oC, 5% CO2 incubator for 15 - 60 minutes, protected from light. Note: The appropriate incubation time depends on the individual cell type and cell concentration used. Optimize the incubation time for each experiment.

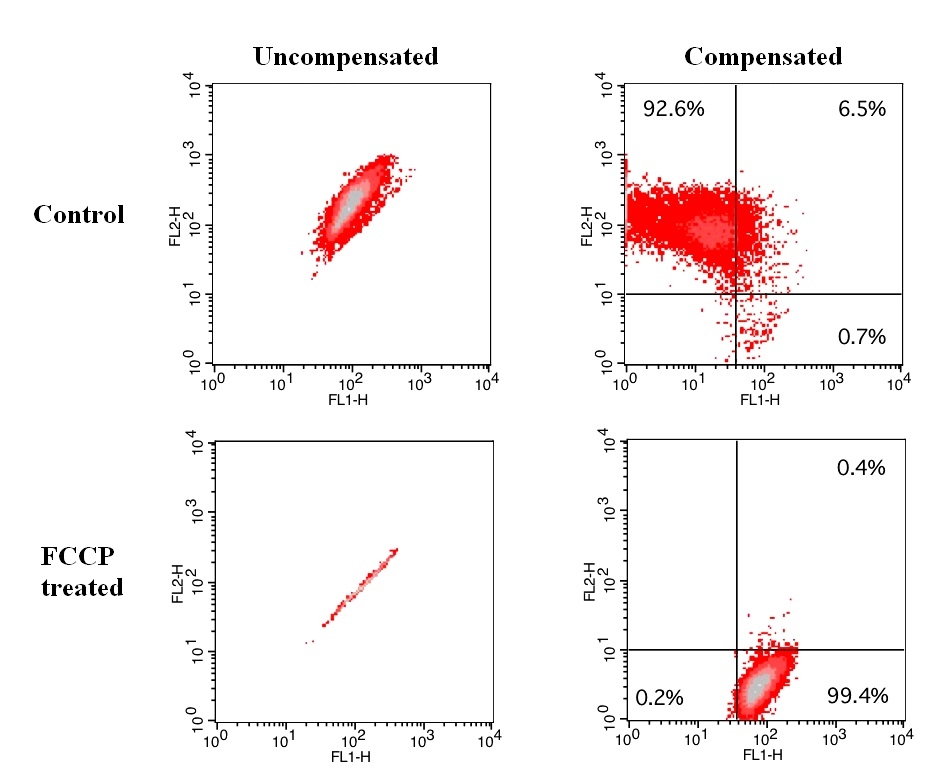
  5. Monitor the fluorescence intensity using flow cytometer with FL1 channel for the green fluorescence monomeric signal (in apoptotic cells), and FL2 channel for the orange fluorescence aggregated signal (in healthy cells). Gate on the cells, excluding debris. It is recommended that compensation corrections be performed using the FCCP or CCCP-treated cells.
  • Typical Flow Cytometer settings for the analysis of JC-10 on a BD FACS Calibur System flow cytometer are as follows:
    Suggested initial conditions may require modifications because of differences in cell types and culture conditions, and also the individual instrumentation.
    FL1 PMT voltage 366 
    FL2 PMT voltage 430
    Compensation: FL1 – 47.2% FL2; FL2 – 47.0% FL1

Spectrum

Citations

View all 100 citations: Citation Explorer
Anticancer activity of salinomycin quaternary phosphonium salts
Authors: J{\k{e}}drzejczyk, Marta and Sulik, Micha{\l} and Mielczarek-Puta, Magdalena and Lim, Gwan Yong and Podsiad, Ma{\l}gorzata and Hoser, Jakub and Bednarczyk, Piotr and Struga, Marta and Huczy{\'n}ski, Adam
Journal: European Journal of Medicinal Chemistry (2024): 117055
Release of mitochondrial dsRNA into the cytosol is a key driver of the inflammatory phenotype of senescent cells
Authors: L{\'o}pez-Polo, Vanessa and Maus, Mate and Zacharioudakis, Emmanouil and Lafarga, Miguel and Attolini, Camille Stephan-Otto and Marques, Francisco DM and Kovatcheva, Marta and Gavathiotis, Evripidis and Serrano, Manuel
Journal: Nature Communications (2024): 7378
A non-Bactericidal Cathelicidin with Antioxidant Properties Ameliorates UVB-Induced Mouse Skin Photoaging via Intracellular ROS Scavenging and Keap1/Nrf2 Pathway Activation
Authors: Feng, Guizhu and Chen, Qian and Liu, Jin and Li, Junyu and Li, Xiang and Ye, Ziyi and Wu, Jing and Yang, Hailong and Mu, Lixian
Journal: Free Radical Biology and Medicine (2024)
Page updated on November 21, 2024

Ordering information

Price
Unit size
Catalog Number22801
Quantity
Add to cart

Additional ordering information

Telephone1-800-990-8053
Fax1-800-609-2943
Emailsales@aatbio.com
InternationalSee distributors
Bulk requestInquire
Custom sizeInquire
Technical SupportContact us
Purchase orderSend to sales@aatbio.com
ShippingStandard overnight for United States, inquire for international
Request quotation

Spectral properties

Excitation (nm)

508

Emission (nm)

524

Storage, safety and handling

Certificate of OriginDownload PDF
H-phraseH303, H313, H333
Hazard symbolXN
Intended useResearch Use Only (RUO)
R-phraseR20, R21, R22
UNSPSC12352200

Platform

Flow cytometer

Excitation488 nm laser
Emission530, 30 nm, 575, 26 nm filter
Instrument specification(s)FITC, PE channel

Components

Effect of FCCP induced mitochondria membrane potential change in Jurkat cells. Jurkat cells were dye loaded with JC-10 dye working solution along with DMSO (Top) or 5 µM FCCP (Low) for 10 minutes. The fluorescence intensities for both J-aggregates and monomeric forms of JC-10 were measured with a FACSCalibur (Becton Dickinson) flow cytometer using FL1 and FL2 channels. Uncompensated data (left column) were compared with compensated data (right column).